
Franchise development
Give candidates a map backed by visible evidence.
Screen territory whitespace against your existing franchisee neighborhoods, then give candidates a clear, evidence-backed record of the comparison.
The problem it solves first.
A territory conversation has to do more than point at population growth or an available parcel. Candidates want to know why an area fits the concept and how it compares with places where the system already operates, and development teams need to tell real whitespace from areas that look open only because the footprint is incomplete.
LookAlike measures neighborhood resemblance on open data and compares each candidate with the nearest relevant store type, so you can show a candidate exactly why an area resembles the territories that already work.
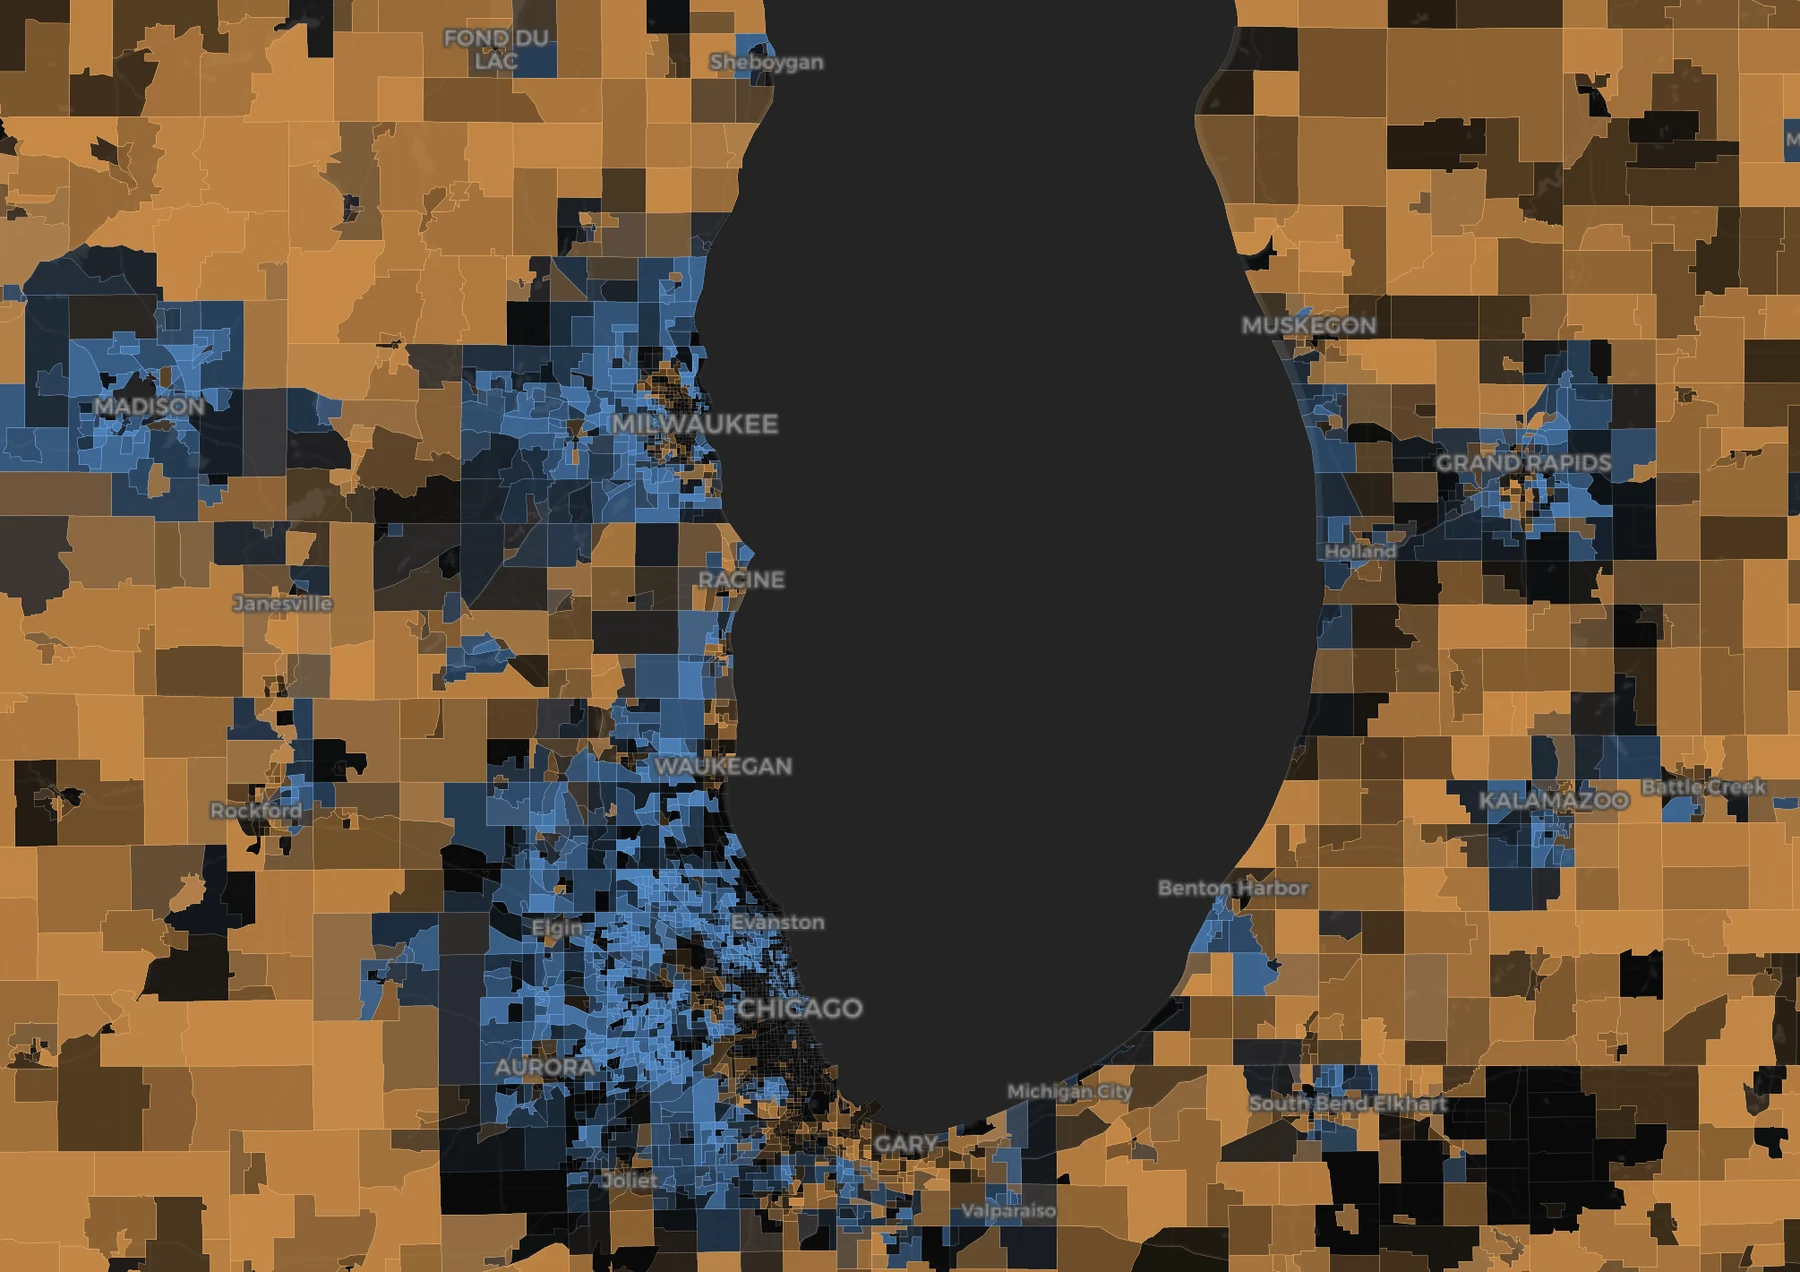
Four ways franchise development teams use it.
- Screen the footprintFind metros whose neighborhoods resemble your proven territories and review open headroom.
- Compare candidate territoriesInspect whitespace, compare candidates with the nearest relevant store type, and apply distance constraints.
- Show the evidenceGive candidates a per-feature explanation, an absolute fit band, and reliability flags they can inspect.
- Shortlist and shareStar candidate neighborhoods, add development notes, and share a scenario that keeps its assumptions.
Questions from franchise development teams
Can candidates see why a territory ranks well?
Yes. Each neighborhood includes a per-feature explanation, an absolute fit band, a robustness result, and reliability flags, and a shared scenario preserves the weights and filters behind the screen.
Does LookAlike define exclusive franchise territories?
No. It screens markets and neighborhoods for resemblance and whitespace. Legal territory boundaries, customer-draw analysis, and site approval remain separate work.
Can we compare candidates with existing franchisee neighborhoods?
Yes. Upload the system's store list or use its available footprint, then rank candidate neighborhoods against the observed store-type archetypes.
See your brand's map.
Pick a plan, upload your store list, and rank every US neighborhood against the places you already win.