
HOW A MATCH IS COMPUTED
Simple enough to explain.
Honest enough to defend.
LookAlike avoids the machine-learning black box on purpose. It is a transparent resemblance measure over open data. Every step below is visible in the product, and every number can be traced to its source.
-
Describe every neighborhood
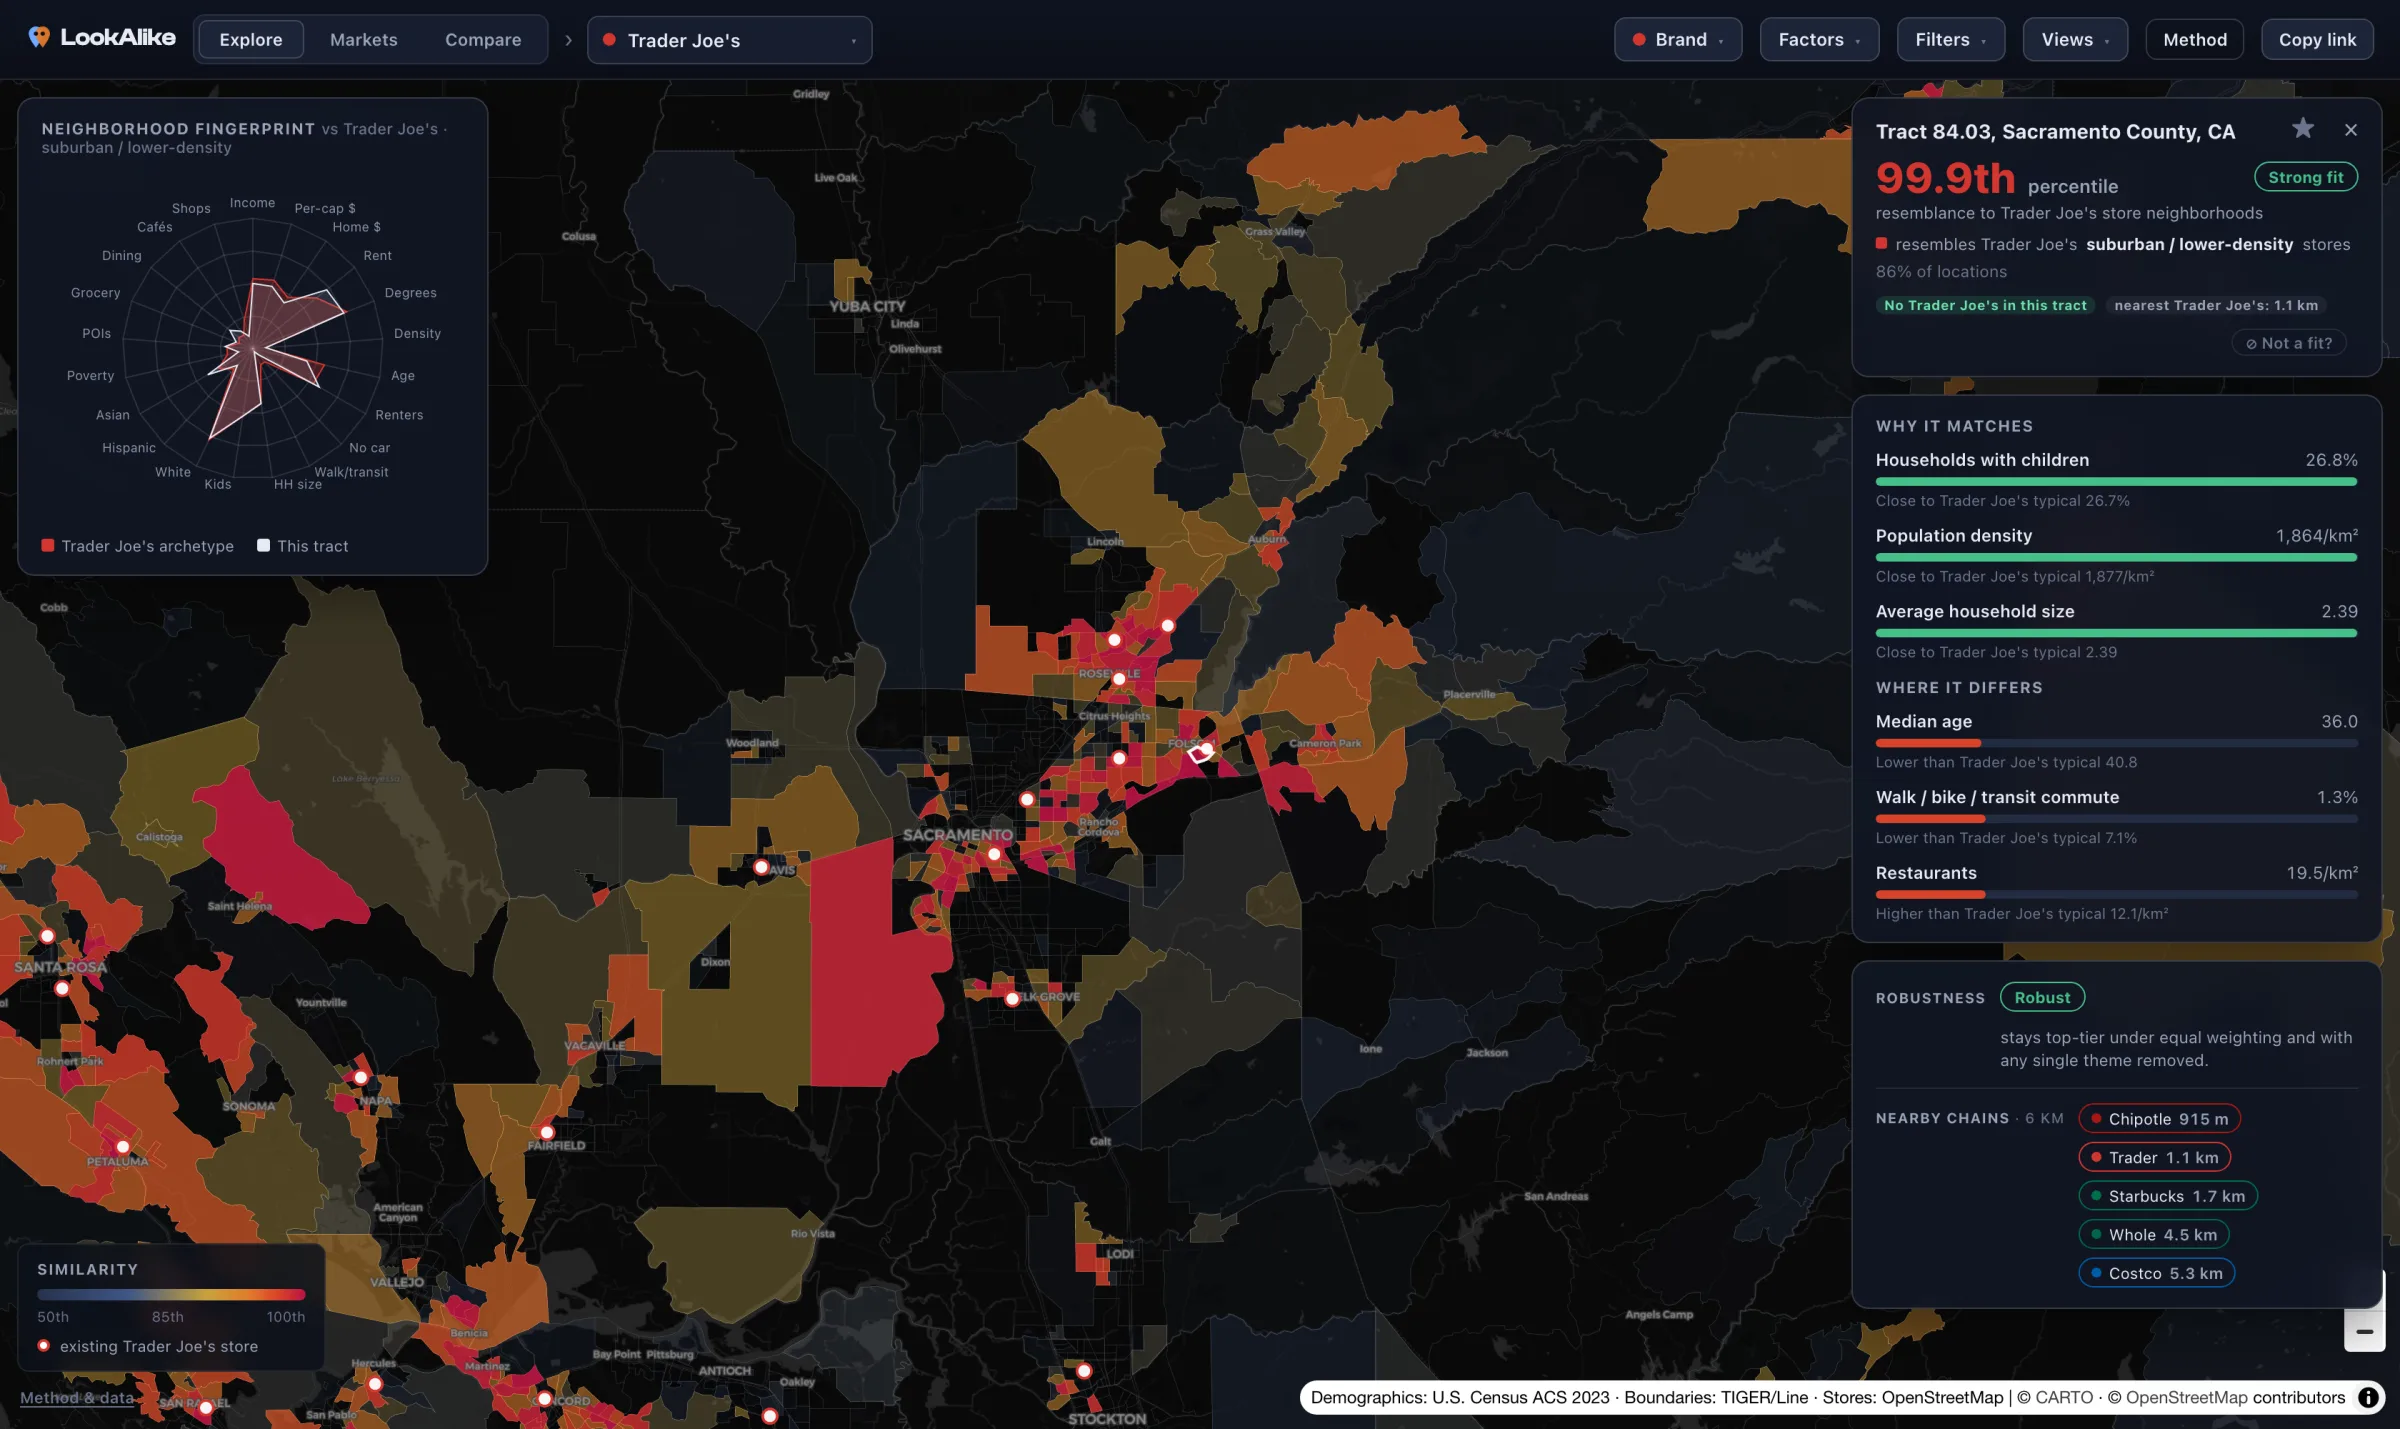
Each of the 83,008 neighborhoods in the continental United States (census tracts) is described by 21 features: income, home values and rents, education, population density, age, renter share, vehicle access, commute mode, household composition, race and ethnicity, poverty, plus the surrounding retail context: the density of points of interest, grocery stores, restaurants, cafés, and shopping.
-
Learn the brand's archetypes
A brand's store locations are mapped to the neighborhoods they occupy: one observation per occupied neighborhood, so a warehouse and its gas pumps don't double-count. Because a chain often thrives in several genuinely different kinds of neighborhood at once (dense urban cores and affluent car-oriented suburbs), the occupied neighborhoods are clustered into up to three store-types, and each type gets its own archetype. The app shows you these store-types by name, with the share of locations in each.
-
Score by nearest archetype
Every neighborhood is scored by its weighted distance to the nearest store-type, because a single averaged archetype would sit between the types and rate real store neighborhoods as mediocre matches. Scores are reported two ways: a similarity percentile against the whole country, and an absolute fit band (Strong, Moderate, Weak) measured against the brand's own store neighborhoods, so a 99th percentile can't hide a mediocre absolute match.
-
Stress-test the answer
For any neighborhood, the robustness check re-scores it under equal weighting and with each factor theme removed, separating ranks that are stable from ranks that hinge on a single theme. Neighborhoods with small populations or large income margins of error carry a low-reliability badge derived from the data's own published error margins. And your factor weights are always visible, adjustable, and saved with every scenario you share.
THE LIMITS, STATED UP FRONT
What the numbers can and cannot say
It measures
- Observable neighborhood resemblance on open demographic and map data.
- Where a brand's existing footprint pattern repeats, including markets it hasn't entered.
- Open white space relative to that pattern, and competitor proximity from tracked chains.
It does not measure
- Revenue, sales, foot traffic, or whether a specific store would succeed.
- Rents, zoning, co-tenancy, visibility, or anything site-specific; that's your diligence.
- Store-location coverage varies by chain; the app states a coverage caveat where it applies.
Demographic resemblance explains only a modest share of store performance. That is exactly why LookAlike positions itself as discovery and triage, not prediction. It ranks where to look. Deciding is still your job.